Welcome traders, in this post, we will learn about another technical indicator that you can start using for your trades and to help you make decisions. you guess it right, the moving average. The moving average really separates it from the others and I think it’s one that everybody should at least understand.
Like other banded types of indicators, such as Bollinger Bands, and STARC bands which we’ve talked about before. The moving average is very similar in the fact that they are all designed to encompass most of the price action.
It just gives you a nice visual of saying where most of the prices occur. most of the time so how do we read the chart?
Table of Content
What are the major moving averages?
It’s very simple you’re going to take a moving average up to yourself, which one you want to use shorter-term traders might use 14-day or 20-day things.
Longer-term traders might use a 50 or a 100, but whichever moving average you select. it’s going to take that number whatever that average is and it’s going to take plus and minus some percentage of that.
which you get to designate so I might say plus and minus 2.5% – 5.0%.
The drawback of it is that the moving average doesn’t account for volatility. That means we must adjust it, for each stock.
However, it is one of its benefits lies. It the different from the other ones and that’s why I wanted to present it to you here.
When we looked at some of the others such as Bollinger bands it uses standard deviations to adjust for volatility.
We looked at STARC bands that used average true range as a way to adjust for volatility.
Bollinger Bands – ( Moving Average )
When using indicators that adjust for volatility,
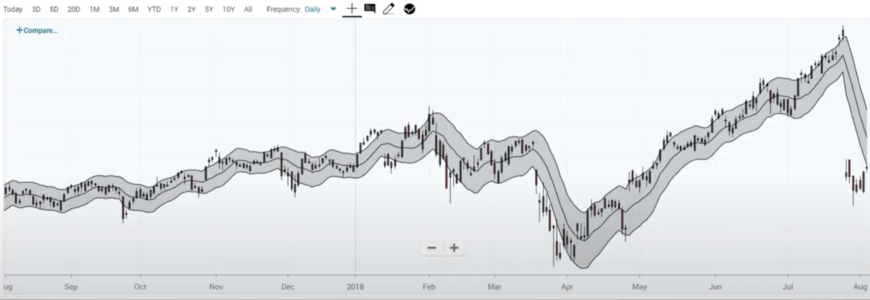
Such as Bollinger Bands, notice that these bands expand and contract based on the volatility.

On the left of the chart, the band is fairly tight but over right after that big drop the band’s widened.
Why do they do that? due to the volatility being higher and that it’s a benefit.
The volatility changes but we can also kind of mask those trends. because I can’t really see just how far these stock prices fell out of a range. because the range is expanding so of course there are other insights we can get from the Bollinger bands.
The main thing is, Moving average isn’t going to have these expansions and contractions.
STARC Bands – ( Moving Average )
here, is the same idea. we’re going to be using the Average True Range instead of the standard deviation.
Again we have areas where the bands are fairly tight and we have areas where they’re wider.
All of these have some type of mechanism that adjust them for volatility.
However, the moving average doesn’t have it, it gives a little bit of an edge compared to these others. In some situations trying to identify changes in the trend.
Moving Average Envelope
For starters, I have put a 50-day moving average here in red and I did that to show that it’s a little hard to see where there are significant breaks.
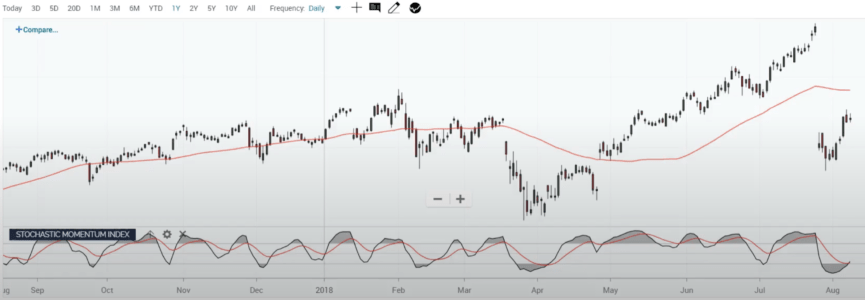
We are clearly below it and that’s significant. but how far below?
Am I still within my plus or minus 5% range, it’s a little hard to visualize.
we can see that these stock prices have broken above this 50-day moving average but is it still within this band?
Can’t really see that.
It’s gonna be a lot easier to see when I put a moving average envelope on.
Indicator settings are:
closing prices
Period: short-term traders probably want to use 14 days to 20 days. 50 days for longer-term stock replacement type strategies.
ShiftType: Use percentages
Moving average type: use simple.
Another thing is that when you’re first setting up your chart we don’t know how wide we need to make these bands and this is a little bit of a downside.
We have to go through trial and error for each stock, just for example let’s say we don’t know.
Moving Average Envelope VS Bolinger bands
shift range = 2%

the first thing to notice, in the moving average envelope, the upper and lower bands are parallel to each other. they’re going to run parallel to this moving average very different from the Bollinger Bands and STARC bands.
it doing plus and minus percent from that moving average. I can easily see that we have hit these upper and lower bands multiple times and even broken them.
We set the percentage too low for this stock.
shift range = 5%

This actually looks pretty good if you look at the start of the chart. notice that we encompassed most of the price action.
The idea is that is the bandwidth that encompasses most of the price action. The first thing to notice is that it’s easier to identify the trend.
We’re just isolating back and forth but notice a significant breakup. this is where it will really start to shine because we can see that this candle clearly broke up above this upper band.
Notice that the candle stayed above it for most of that trend. this tells me that’s a very significant trend.
It broke this upper band at plus 5%and because I’m not accounting for the volatility it’s very evident that these candles are staying above it.
This is going to show me we’re in a very strong uptrend right here this is where you might want to do some strategies.
To make the comparison when using Bollinger Bands it was harder to tell when the stock price turns due to its adjusting for volatility.
Summary
Another way of looking at it was very clear that we have broken above this trend and we are definitely above it so when you use something like a moving average envelope especially when you’re looking at your major moving averages we can also compare it against some of our lower studies and you’d be surprised at how many times this will give you a much clearer picture and a lot more confidence to stay in those strong upward trends and roll those call options up that’s where the money is and the moving average can help you capture it.
for those who’d like to learn more about options trading please check “Is covered call a good strategy?” or “Options trading for beginners“