
In this article, I will show you the best swing trading indicators and how you can use them to trade for a consistent income.
How does Swing Trading work?
Let’s take a look at the swing trading method before we start the analysis. Swing Trading is a trading strategy that consists of different strategies and habits which share some common characteristics closely associated with the period in trading. While mainly used in forex and shares trading, crypto has the potential for other uses. Using swing trading you can have a position open for a few days/weeks if the trend continues to your advantage. The traders will likely close their positions if trends reverse themselves.
What Is Swing Trading?
A swing trader opens a position based on his price expectations and hopes to make a profit if the market moves in the expected direction. Swing trading positions are usually held overnight and may remain open for days or weeks.
Swing trading is based on the concept that price declines are a common phenomenon in the market.
When a price moves up and down, it’s called a swing. Swing traders use these fluctuations to take trading positions and take profits.
Even though some swings may be smaller and result in a smaller profit, a swing trader who consistently executes his trade can end up making and accumulating a substantial profit.
Technical indicators are often used to help swing traders identify entry and exit points for their positions.
Table of content
- How does Swing Trading work?
- Best Swing Trading Indicators
- Moving Average Convergence Divergence (MACD)
- Is MACD good for swing trading?
- Relative Strength Index (RSI)
- RSI discrepancy
- Volume weighted average price (VWAP)
- Simple moving averages (SMA)
- SMA Example
- Understanding the limitations of swing trading indicators
- Final Thoughts
- P/E Ratio
Best Swing Trading Indicators
I have compiled the best swing trading indicators that stand out for their simplicity and efficiency of trading signals. However, it’s worth mentioning that they can by no means guarantee you constant profits. This is mainly due to the fact that technical indicators don’t predict the future, but help you to better understand the present and the past Here are the most popular and reliable technical indicators used in swing trading.
Swing Trading Works Before getting more in-depth with analyzing the best indicators for swing trading, let’s go back to the swing trading process. Swing trading is a trading style that comprises various strategies and behaviors that share some common aspects closely related to the time of a trade.

Moving Average Convergence Divergence (MACD)
The MACD is a trend indicator, i.e. it shows you when a trend change in a stock is imminent.
MACD is a momentum indicator oscillator.
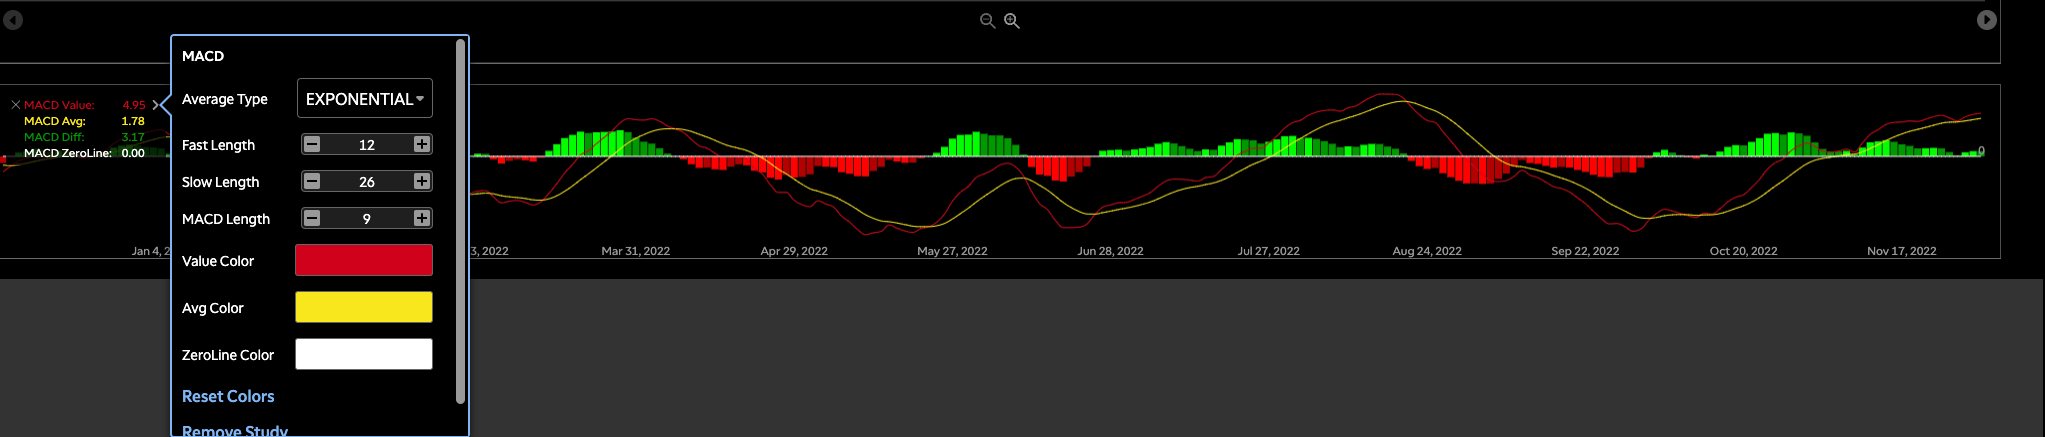
Whether it’s going to break out to the upside or to the downside. When you first add the MACD to your chart, it looks like the picture below.
Now it’s important that you don’t change these settings unless you have a specific reason to do so. We know that swing trading and day trading are often about self-fulfilling prophecies. What I mean by this is that often many swings or day traders see the same pattern at the same time and use that pattern to enter the trade.
If enough traders do this at the same time, they create enough buying pressure to drive the stock higher and create a self-fulfilling feedback loop.
You should always use the default settings 12, 26, and 9 because the point of these indicators is that you see what everyone else sees too
let’s dive a little deeper into what the MACD actually is. The MACD calculates by subtracting the 26-EMA from the 12-EMA (exponential moving average) and creating a constantly updated line that resembles a moving average.
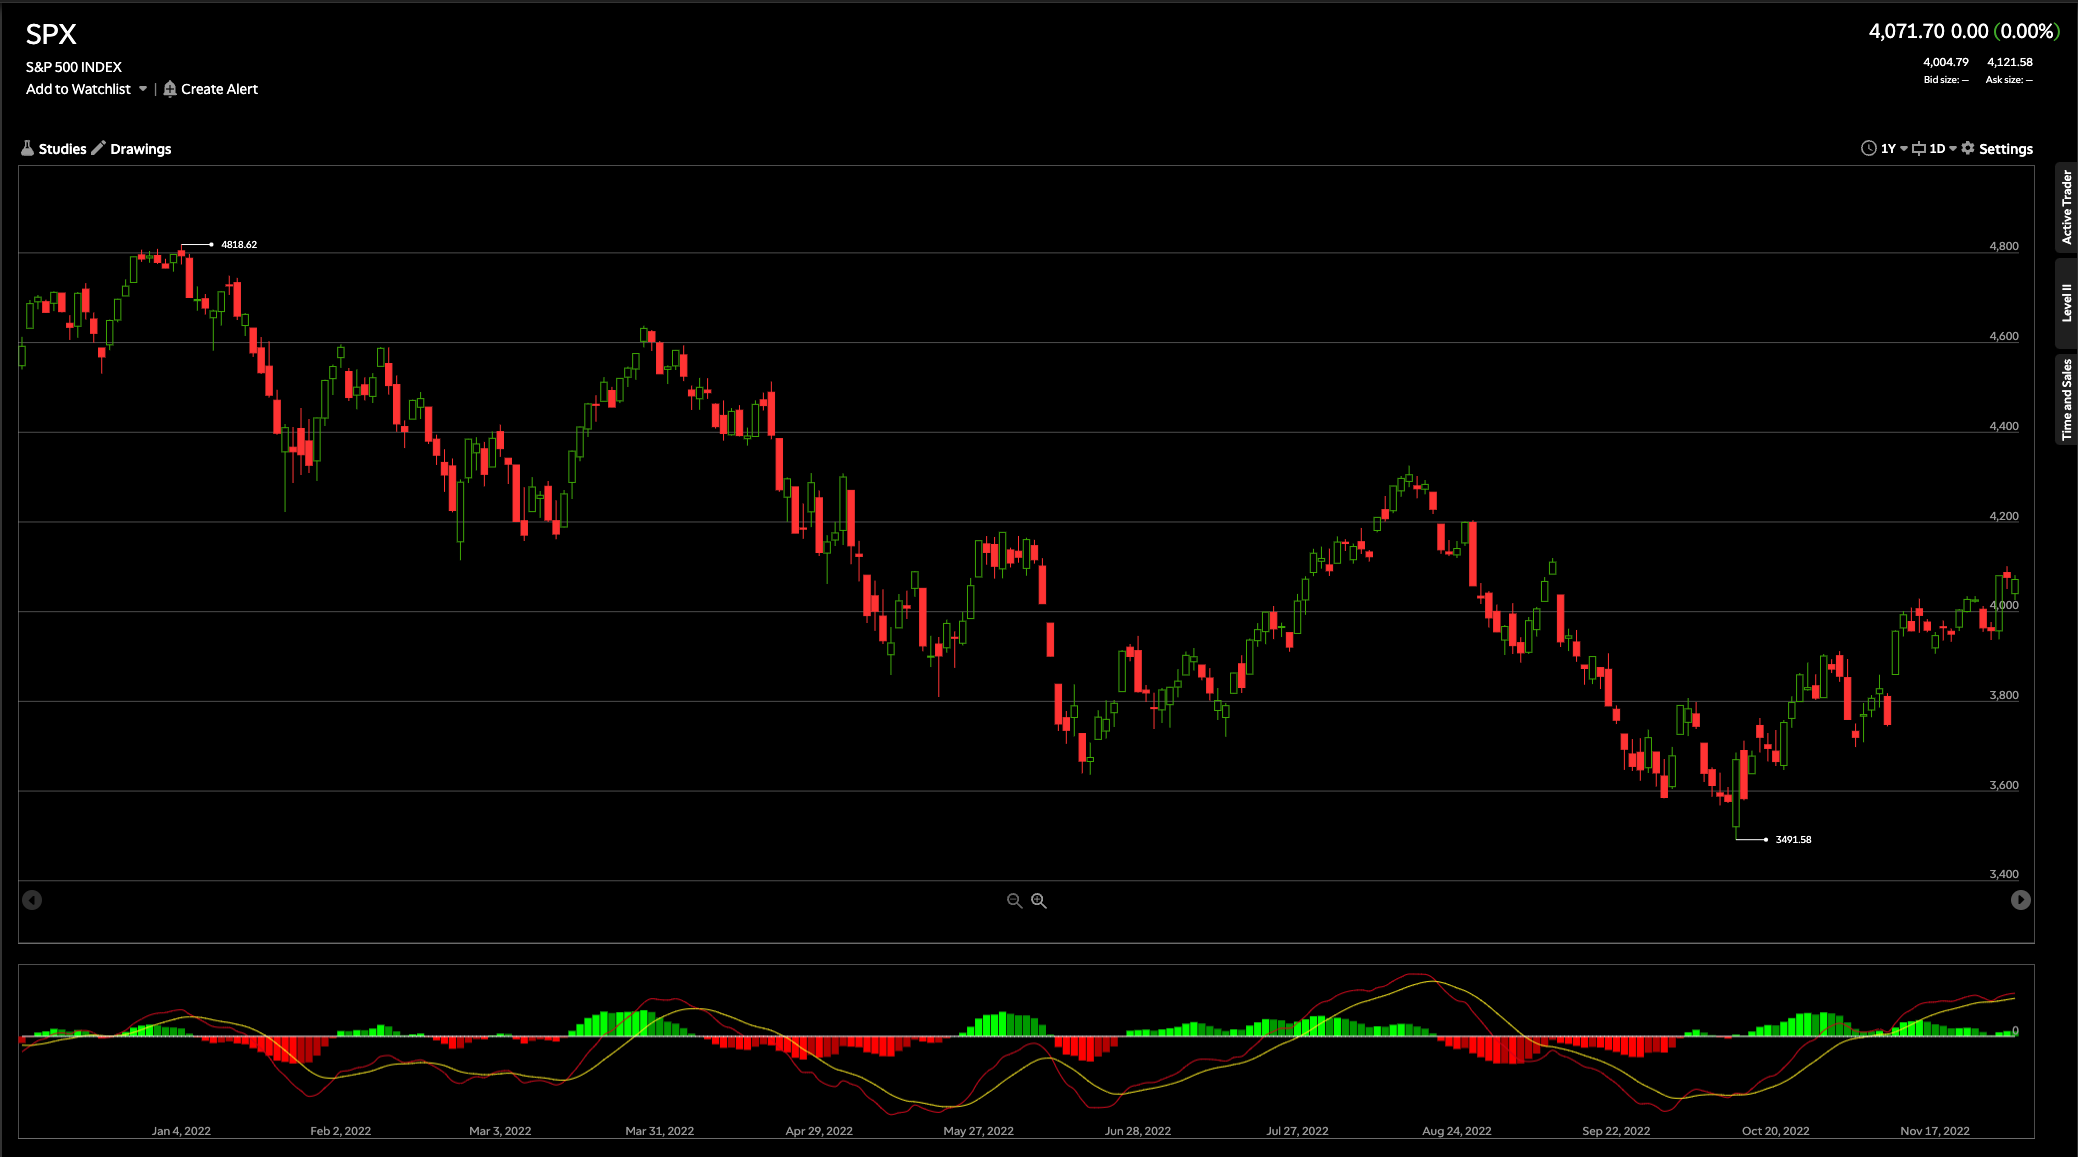
Swing trading indicators
Also, a 9-day EMA add to the MACD line to indicate buy or sell signals. The most common way to use MACD as a swing trading indicator is to look for divergences or a crossing of the center line of the histogram.
At least, in theory, MACD indicates buying opportunities when it crosses above zero,
when it crosses below zero it indicates selling or shorting opportunities.
if you’re looking for a simple swing trading strategy for beginners, you can essentially wait for the red bars to cross and become green bars, then enter a trade and buy when that happens.
it shows you that the stock has a lot of power and momentum.
What does the MACD tell you?
The MACD consider one of the best swing trading indicators, but you need to understand how to use it and what it tells you.
I see a lot of people using it in a way that’s too simple
if it was as simple as I just described it.
if it was as simple as I just described it and you just bought a stock every time it changed from red to green, we’d all be billionaires right now.
That’s not the case, of course.
So what the MACD tells you from a more advanced perspective is that it tells you the change in momentum of a stock.
when the Moving Average Convergence Divergence shows the difference between a 12-period moving average and a 26-period moving average, it’s always greater than zero.
it’s just telling you that the most recent asset’s price change, the 12-day price movement,
is stronger than the 26-day price movement before that, so simply put, it’s showing you that the stock is gaining momentum.
Recent asset’s price action is stronger than in the past, if the green bars keep growing and getting bigger,
it shows you that the stock is getting even stronger and the momentum for swing trading is increasing,
i.e. that you can catch the momentum.
this is really one of the best swing trading indicators I use regularly.
Is MACD good for swing trading?
Moving average convergence varies between trading platforms. This tool helps identify new patterns of behavior, be that bullish or bearish. Because the trading of the trend is the most important strategy.
Relative Strength Index (RSI)
The next swing trading indicator discussed in this article is the relative strength index (rsi).
The RSI developed by J. Wells Wilder is actually a momentum oscillator that simply measures the speed and change of price movements.
Swing traders prefer this indicator because it quickly detects a trend, the overbought and oversold levels. The rsi traditionally fluctuates between 0 and 100. the rsi is considered overbought when it’s above 70 and oversold when it’s below 30. Signals are generated by looking for divergences and breakdowns.
RSI can use to identify the general trend
UP Trend
In an uptrend or bull market, the RSI tends to stay in the 40 to 90 range, with the 40 to 50 range typically acting as support.
Down Trend
During a downtrend or bear market, the rsi tends to stay between 10 and 60, with the 50 or 60 zones serving as resistance.
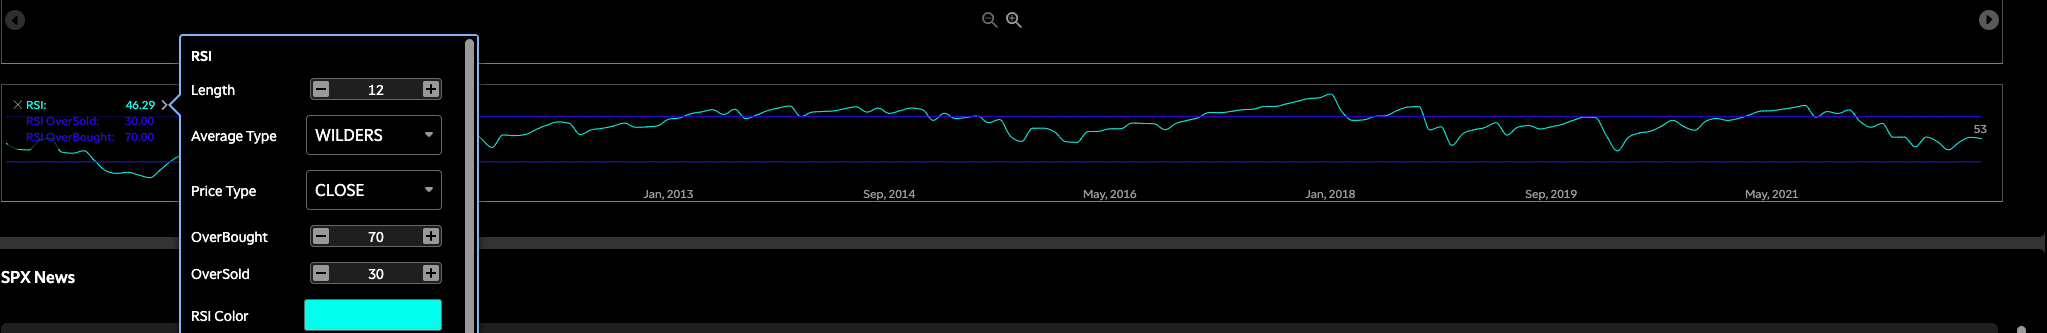
These ranges vary depending on your settings and the strength of the underlying trend of the stock or market.
Usually, people use RSI as a kind of warning sign: If the stock is very high,
it probably can’t go any higher because it’s overbought.
On the other hand, if the RSI of a stock is super low, say at 20 or 30,
then the RSI is so oversold that it may be wise to buy the stock before the reversal.
A better way to use the RSI is to look for discrepancies between the indicator and the actual price movement of the stock.
RSI discrepancy
A Relative strength index discrepancy occurs when a stock price rises but the rsi falls. It can also occur the other way around when a stock price is falling and the rsi is rising.
This discrepancy in the rsi of the stock price is a pretty strong signal that something isn’t quite right.
if the price of stock continues to rise, but the rsi, which actually measures the momentum indicator,
is falling, this trend obviously cannot continue.
RSI uses volume and buying pressure to predict fluctuations and momentum.
Volume weighted average price (VWAP)
The next technical indicator we’ll look at is the VWAP.
One of the best indicators to learn is, It’s usually used for day trading,
but I also use it regularly for swing trading.
the volume-weighted average price (VWAP) is a trading indicator calculated by multiplying the number of shares purchased by the share price and then dividing by the total number of shares purchased.
basically, it shows the average price of a stock based on the volume traded at a given price. It’s usually calculated and displayed on your chart within a one-day time frame and looks similar to a moving average, although it’s a much slower and lagging indicator.
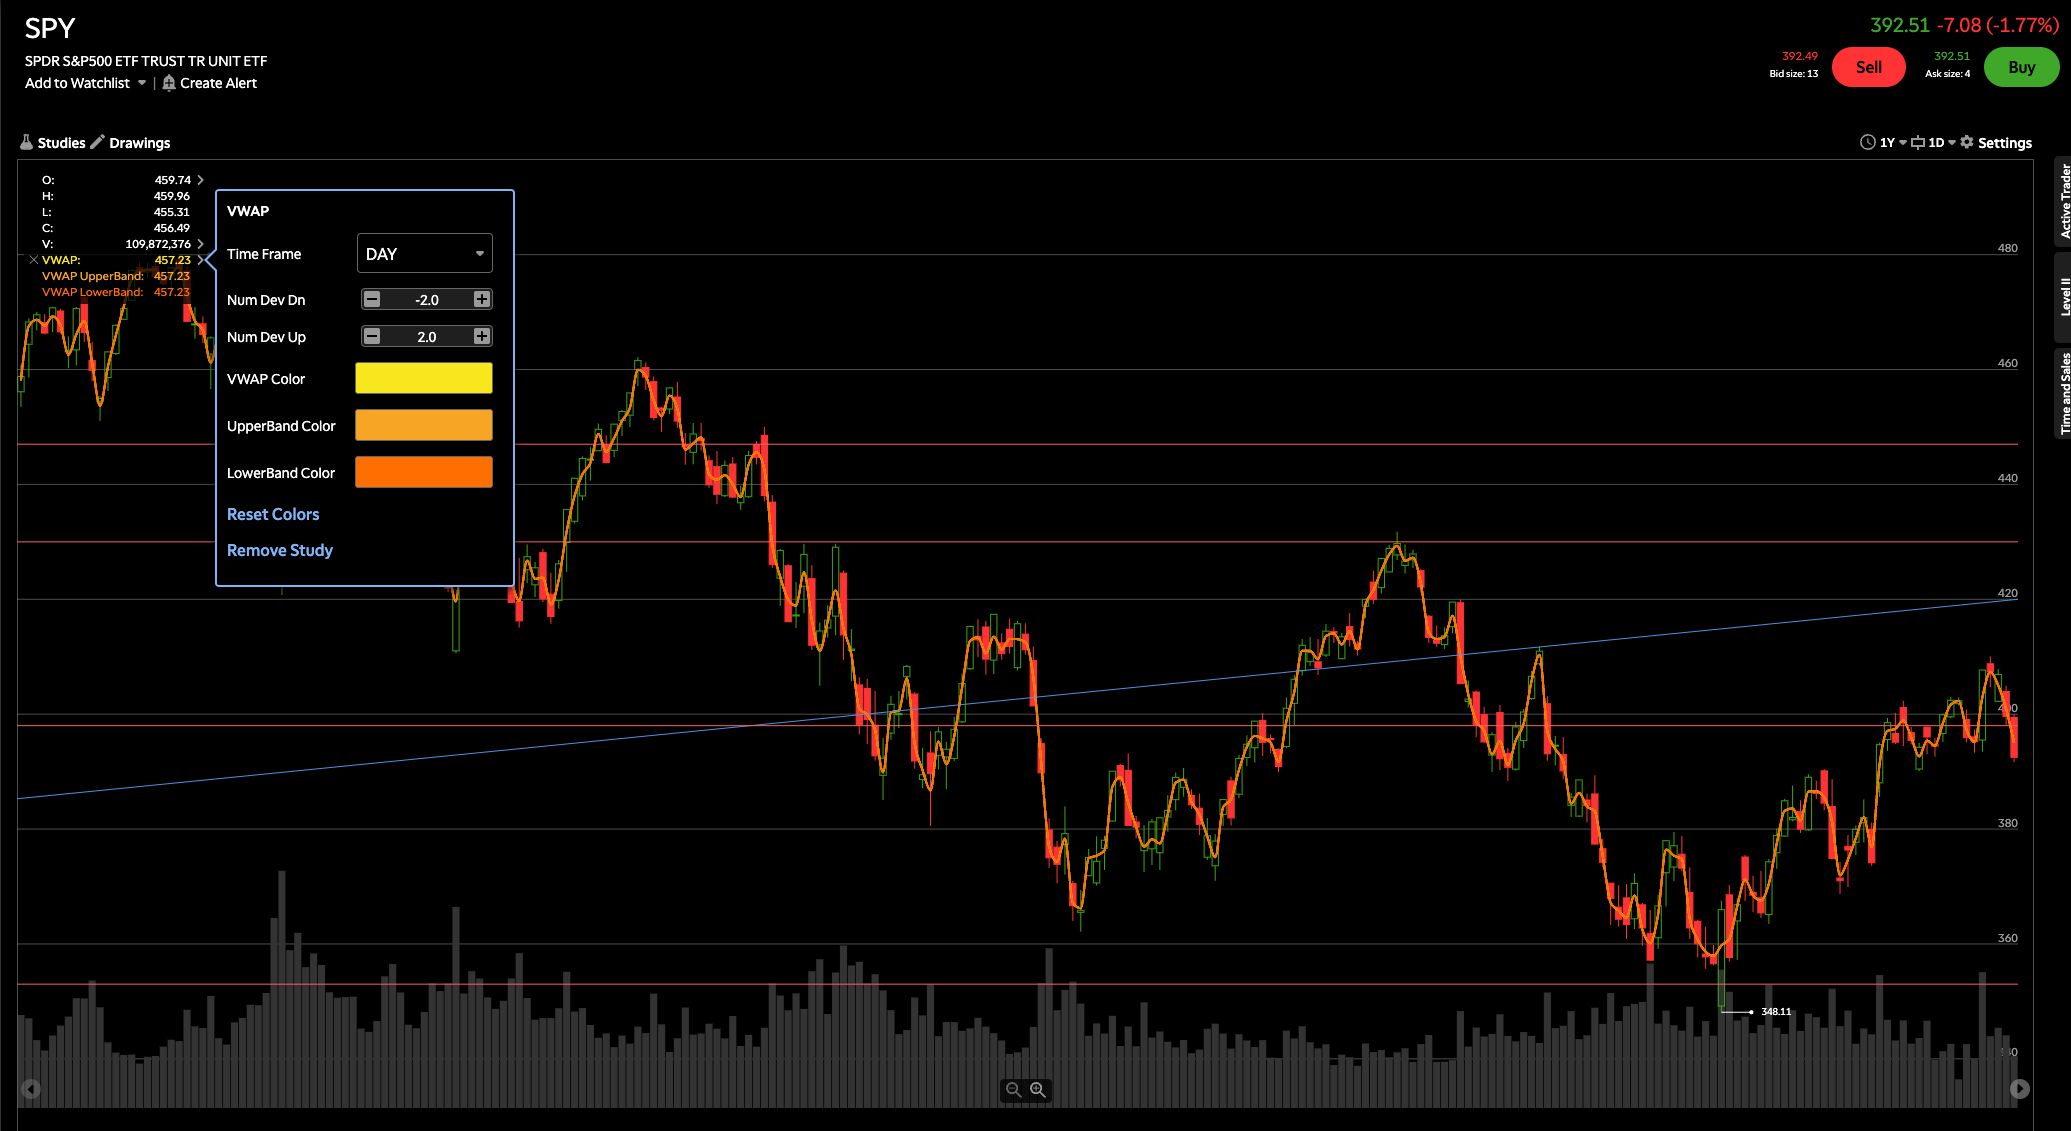
Many swing traders use the strategy of buying the stock if it closes the day above the VWAP,
and selling or shorting the stock if it closes the day below the VWAP.
As a swing trading indicator, it’s important to understand swing trading indicators that the VWAP often acts as a support and resistance level.
When it acts as a support line, it means that stock often falls to the VWAP,
hits the outlook up, then bounces off it and goes back up, finding support at that line.
On the other hand, if a stock is trending up, it’ll sometimes go up to the VWAP, but then not be able to break through it
If a stock is above the VWAP for an extended period of time,
that’s a very good sign of strength and could be an indication that we should buy the stock for a swing trade if there are also other positive indicators that we can use.
Simple moving averages (SMA)
A simple moving average is a technical indicator or tool,
that tracks the price of a security over a period of time and plots it on a line.
This essentially “smooths out” price fluctuations, giving an investor a general idea of where the trend is going.
Using simple moving averages to determine trends can help an investor better identify buy and sell signals.
To create a simple moving average chart, first, choose a time frame. A frame can be any period of time – such as a day, a week, or even a month. For this example, we define a time period as a day.
We create a moving average using a 20-day chart. We take the prices of each day and add them together. Then we divide that number by our time frame, which in this case is 20.
This gives us today’s 20-day average price,
which is a short-term moving time frame that can be used by active traders.
To create a moving average, each day we omit the last day in the time frame and add today.
A 20-day moving average can help determine short-term uptrends, downtrends, and sideways trends.
By looking at a security’s moving average in relation to its current price, you can identify potential buy signals.
SMA Example
For example, if a price breaks an upward-moving average, it could mean it’s a good time to buy a stock.
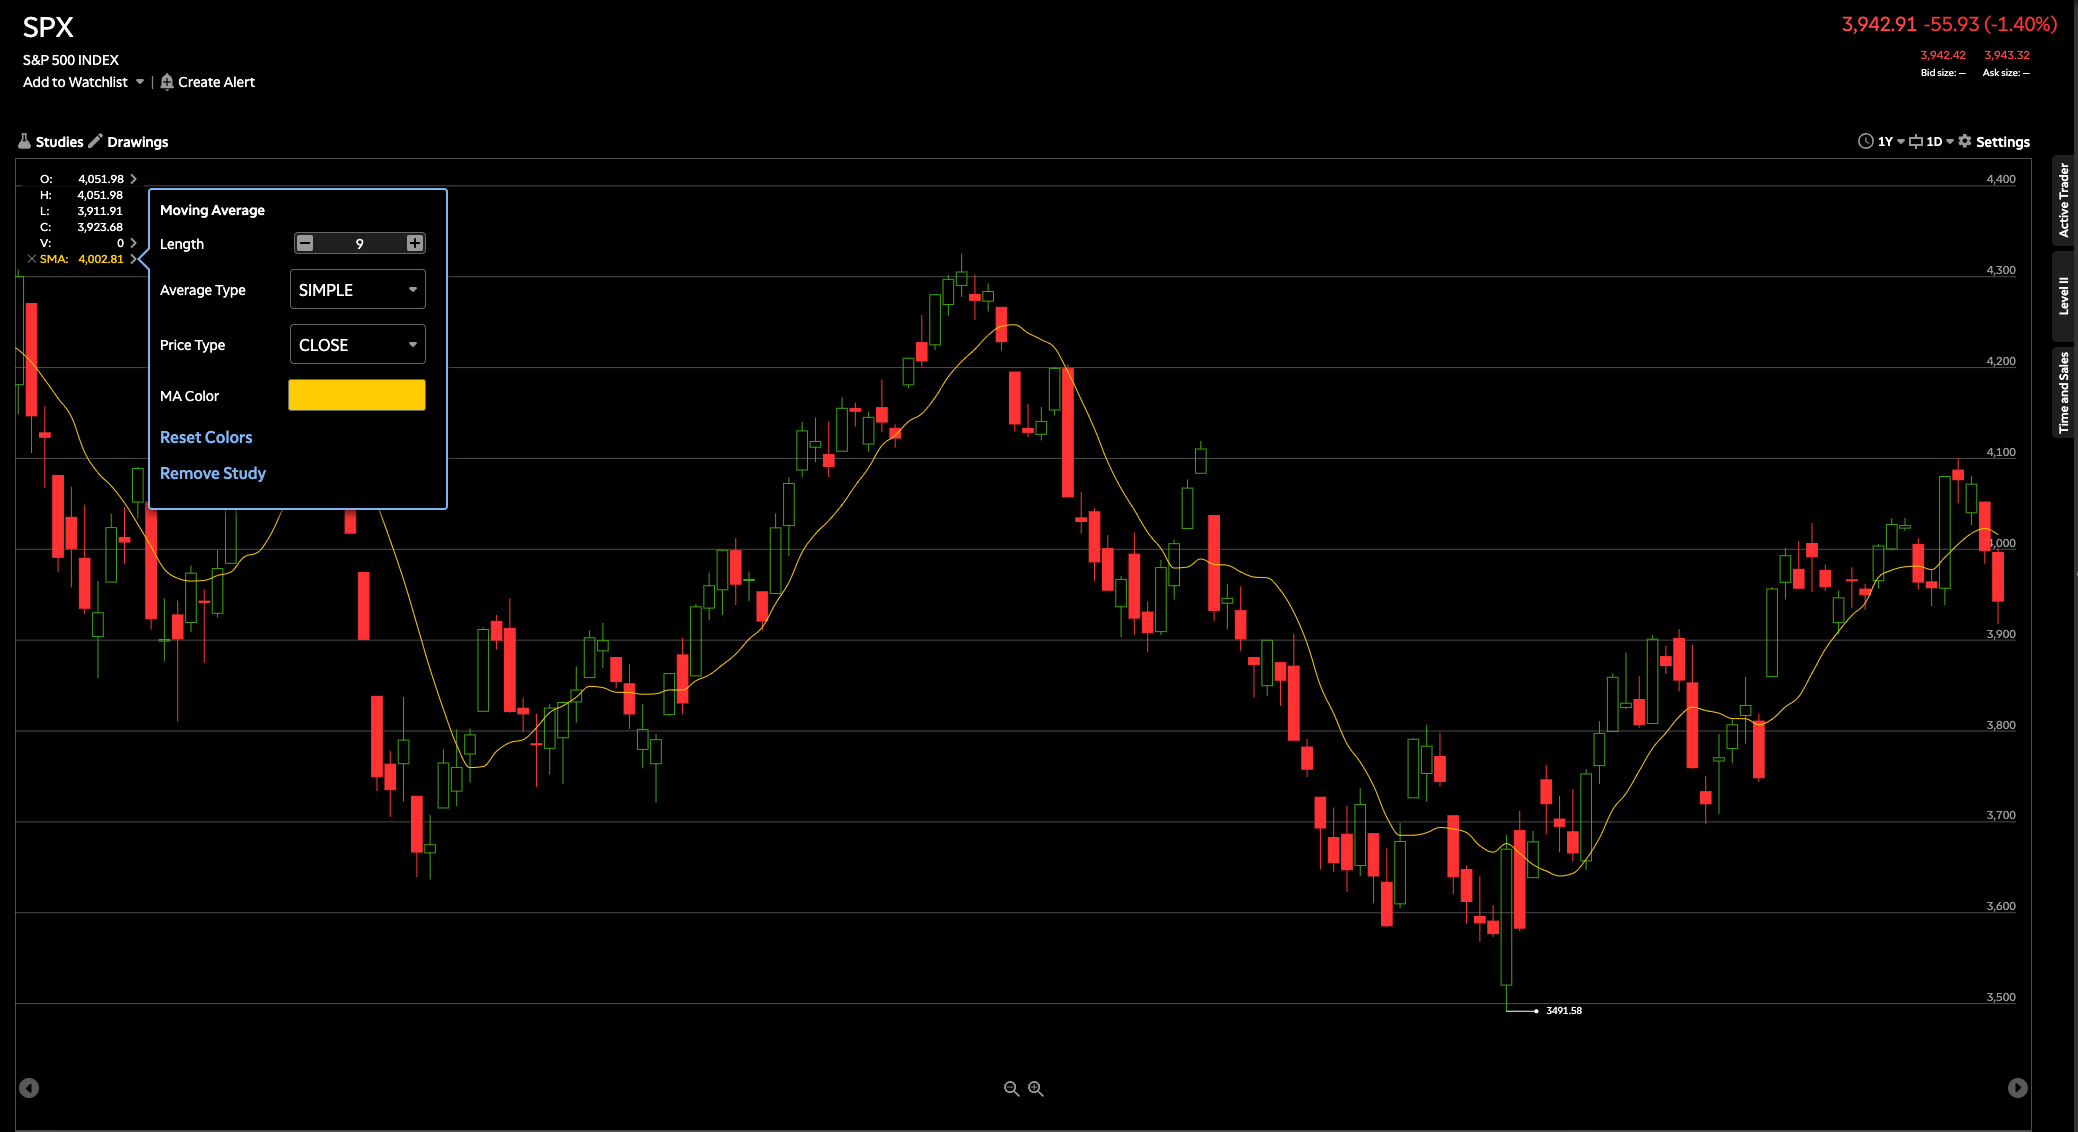
Another buy signal could be a support bounce.
This is when the moving average of a security serves as a support level for the price.
If the price falls to the moving average and then rises again, this can be used as a buy signal.
Conversely, moving averages can help investors identify when to sell a position.
For example, if the price of a stock rises to the moving average and then bounces back, this can be a sell signal.
Looking at a simple moving average over a short-term time frame can be very helpful, but it also has its drawbacks.
SMA Whipsaws
One thing to be aware of is whipsaws. A whipsaw is when the stock crosses the moving average, which gives a signal, and then quickly reverses, which gives the opposite signal.
A short-term time frame, such as 20 days, usually indicates more swings, which is why some investors prefer to use medium- and long-term time frames.
For example, medium-term charts with a 50-day SMA show a smoother average and have fewer buy and sell signals.
As a result, investors can stay in a trade longer. Long-term trends, like those of a 200-day SMA, are even smoother.
Consequently, these types of moving average lines react quickly to the price changes of securities.
This is helpful for active traders who want to place short-term trades.
It’s also important to know that moving averages don’t predict future trends but only confirm established trends.
Despite these drawbacks, moving averages are a powerful technical analysis tool that you can use to determine trends and identify buy and sell signals.

Understanding the limitations of swing trading indicators
The indicators for trading in this article are a good starting point. Trading indicator indicators aren’t superior to most technical analyses and are never considered the holy grail. It cannot guarantee that the profits that are produced by trading indicators will be rewarded. These are some factors that affect a trader’s success in swing trading.
Swing traders operate with larger timeframes, they are not interested in short-term price volatility the same as day traders do. For swing traders, the only thing that matters is that swing highs go higher in a bullish market while swing lows go lower in a bearish market.
Final Thoughts
I have highlighted some of the best indicators for swing trading in this article.
Within the context of financial markets, Price patterns and trends based on historical performance are then used to identify signals according to things like market sentiment and psychology.
Most traders use swing trading as their most common trading style along with day trading and position trading.
It is usually used in the daily chart and larger timeframes. For beginners, this trading style is less intimidating as it’s less hectic than day trading but comfortable enough to profit from price fluctuations. Traders who prefer this type of trading style usually rely on swing trading indicators, as it’s important for them to show the support and resistance levels when the trend changes.